Shifting Left in C++ Development & Testing
Background
While researching about Test Driven Development (TDD) and software testing levels I found the following diagrams about how Shifting-Left influence the cost of software development.
Shifting-Left refers to moving testing and quality measures to earlier phases of the development lifecycle to reduce costs and improve quality.
This is very relevant for C/C++ products, because C/C++ is a very powerful language but on the other hand more error prone.
![[1] Before Shifting-Left](https://www.stickyminds.com/sites/default/files/shared/2018-12-10%20ArthurHicken%20The%20Shift-Left%20Approach%20to%20Software%20Testing%20image3.png)
![[2] After Shifting-Left](https://www.stickyminds.com/sites/default/files/shared/2018-12-10%20ArthurHicken%20The%20Shift-Left%20Approach%20to%20Software%20Testing%20image6.jpg)
In general diagram [1] illustrates the traditional approach, whereas diagram [2] visualizes the benefits of the Shift-Left approach.
What do this two charts exactly show? We have 3 curves:
- blue: Percentage of defects introduced - most done in coding phase
- orange: Defects found - most found in testing phase
- red: Costs to fix a defect - exponential growth
The charts also shows that most of defects are found in the three testing phases (expenditure in descending order):
- Unit Testing
- Functional Testing
- System Testing
The Shifting-Left theory says that the number of defects can be reduced if the testing starts early (see [2]).
C/C++ Early Testing
How can C++ developers implement early testing to reap the benefits of the Shift- Left approach.
We can split the testing in dynamic testing and static testing.
Dynamic testing verifies runtime behavior, while static testing analyzes the source code to identify potential issues early.
Dynamic testing
The basic of the dynamic testing in a first step should be the introduction of unit tests. The recommendation would be to plan how to introduce Unit tests to the project in an early stage of the planing. There is no standard framework for unit tests in C/C++ and a lot of libraries are on the market. Additionally we could add the following tooling to analyze the data of the Unit tests:
- Code coverage
- Memory leak detection
- Performance analysis
- Mocking/Faking Framework
Static testing
Additionally static testing would enhance our code quality especially if we start with it with the beginning of the project. The following set of tools are a good entry point:
- Static code analysis
- Code formatting
CI/CD Pipeline
Static and dynamic testing should be integrated into a CI/CD pipeline to ensure they run on a regular basis. Modern Git servers like GitHub or GitLab can execute pipelines for each commit and display the results directly in the repository.
Example Tooling for a Linux C++23 Project
Let it be suppose that we have a new C++23 product. As a build tool we use CMake. The platform is Linux.
The following set of tools can be easily set up initially before staring the development phase.
Dynamic testing Tools
Unit test framework: Catch2
Memory leak detection: Valgrind
Performance analysis: Linux Perf & FlameGraph
Mocking framework: FakeIt
Catch2 and FakeIt are very easy to implement because they are header only framework. Valgrind and Perf are almost standard frameworks on Linux for memory analysis and performance messurments.
Static testing Tools
Static code analysis: Cppcheck
Code formatter: ClangFormat
Cppcheck is a community driven project that is on the market for years same as ClangFormat.
Conclusion
Shifting left in C++ development emphasizes early testing to reduce costs and improve software quality. By combining dynamic testing, static analysis, and modern CI/CD pipelines, teams can catch defects early and maintain robust, reliable code. Adopting the right tools and integrating them into your workflow ensures continuous improvement and long-term project success.
Resources
Thought about Jitsi

Background
I read a very interesting article about the State of Hessen in Germany that failed to implement a customized Jitsi instance and had to temporarily switch to Webex. The article can be found on the German IT magazine heise. The reason for the delay was not clear.
This sparked my curiosity about Jitsi and its capabilities.
Jitsi Introduction
Jitsi is an open-source video conferencing platform that runs directly in your browser, requiring no accounts or software installation. It offers features like screen sharing, chat, and end-to-end encryption, making it a free and privacy-focused alternative to proprietary tools.
Unique Features
Jitsi stands out with several key features:
- Browser-based, no accounts required: Easy setup without installations.
- Open source and free: Fully customizable and transparent.
- Self-hosting: Full control over data and GDPR compliance.
- Privacy-focused: End-to-end encryption and no data tracking.
- Efficient scaling: Handles large meetings via Jitsi Videobridge.
Free to use Jitsi Instances
There are several free Jitsi instances available. For example the TU Ilemnau hosts a instance everybody can use. However, some institutions, such as the Goethe University Frankfurt, have migrated to other tools, likely due to technical or operational challenges.
First Impression
I play around a little bit with the instance of TU Ilemnau. I really like the look and feel of Jitsi.
I explored the TU Ilmenau Jitsi instance and was impressed by its user-friendly interface and functionality. It feels intuitive and modern, making it easy to set up meetings without additional software or accounts.
Conclusion
My first impression of Jitsi was very positive. In the future, I plan to explore its capabilities further, including hosting my own instance using Podman, a container management tool similar to Docker.
Resources
Basics: Loadbalancing with NGINX
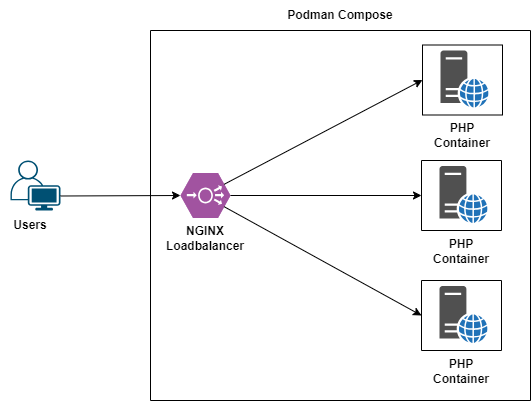
In this guide, we will walk through the steps to set up a simple load balancing environment using NGINX and Podman. This setup will distribute traffic across multiple instances of a PHP web application in round robin mode.
Prerequisites
- Podman installed
- Podman compose installed
An instruction for Ubuntu 22.04 can be found here.
Setup
The complete example can be found on GitHub.
First, let’s structure our project directory as follows:
.
├── app
│   ├── Dockerfile
│   └── index.php
├── compose.yaml
└── nginx
    └── nginx.conf
The App: Simple php Web Interface
Create a simple PHP web interface that shows the current hostname in app/index.php:
<!DOCTYPE html>
<html lang="en">
<head>
    <meta charset="UTF-8">
    <title>Hostname Example</title>
</head>
<body>
    <h1>Welcome to the Server</h1>
    <p>Served from: <strong><?php echo gethostname(); ?></strong></p>
</body>
</html>
The App: Dockerfile
Create a Dockerfile in app/Dockerfile to build the PHP application:
FROM php:8.2-apache
COPY index.php /var/www/html/
NGINX Configuration
Create an NGINX configuration file in nginx/nginx.conf:
events {}

http {
    upstream backend {
        server app1:80;
        server app2:80;
        server app3:80;
    }

    server {
        listen 80;

         location / {
            proxy_pass http://backend;

            # Backend-Hostname als Header übergeben
            proxy_set_header X-Backend-Hostname $upstream_addr;
        }
    }
}
Compose everything
Create a compose.yaml file to define the services:
version: "3.9"

networks:
  default:
    name: loadbalancer1_default

services:
  app1:
    build:
      context: ./app
    container_name: app1
    hostname: app1
    ports:
      - "8081:80"

  app2:
    build:
      context: ./app
    container_name: app2
    hostname: app2
    ports:
      - "8082:80"

  app3:
    build:
      context: ./app
    container_name: app3
    hostname: app3
    ports:
      - "8083:80"

  loadbalancer:
    image: docker.io/nginx:alpine
    container_name: loadbalancer
    ports:
      - "8080:80"
    volumes:
      - ./nginx/nginx.conf:/etc/nginx/nginx.conf
    depends_on:
      - app1
      - app2
      - app3
Start and test
To start the environment, run:
podman-compose up
Then, open your browser and navigate to http://localhost:8080/. You should see the PHP web interface served from different backend servers, demonstrating the load balancing setup.
Conclusion and Key Learnings
In this guide, we have set up a basic load balancing environment using NGINX and Podman. Here are the key learnings from this exercise:
- Containerization with Podman: We learned how to containerize a simple PHP application using Podman.
- Load Balancing with NGINX: We configured NGINX to distribute traffic across multiple instances of our PHP application.
- Service Composition with Podman Compose: We used Podman Compose to define and manage multiple services, making it easier to orchestrate our application and load balancer.
- Practical Networking: We explored how to set up networking between containers to enable communication and load balancing.
With these steps, you have a foundational understanding of how to set up load balancing for containerized applications using NGINX and Podman. This setup can be expanded and customized further based on your requirements.
Install Podman Desktop on Ubuntu 22.04 LTS

Podman is a daemonless container engine for developing, managing, and running OCI Containers on your Linux system. In this guide, we will walk you through the steps to install Podman Desktop on Ubuntu 22.04 LTS.
Install Podman
First, update your package list and install Podman:
sudo apt-get update
sudo apt-get -y install podman
Install Podman Compose
To install podman-compose, follow these steps:
1. Install python3-pip:
sudo apt-get -y install python3-pip
2. Install podman-compose using pip3:
sudo pip3 install podman-compose
Install Podman Desktop
To install Podman Desktop, we will use Flatpak. First, install Flatpak:
sudo apt install flatpak
Then, install Podman Desktop from Flathub:
flatpak install --user flathub io.podman_desktop.PodmanDesktop
Finatlly you can run Podman Desktop with:
flatpak run io.podman_desktop.PodmanDesktop
Fix CNI Plugin Problem
It can be that you are facing the following problem with Podman Compose:
WARN[0000] Error validating CNI config file /home/mike/.config/cni/net.d/cni-podman1.conflist: [plugin bridge does not support config version "1.0.0" plugin portmap does not support config version "1.0.0" plugin firewall does not support config version "1.0.0" plugin tuning does not support config version "1.0.0"]
It can be fixed with the following installation:
sudo snap install curl

curl -O https://archive.ubuntu.com/ubuntu/pool/universe/g/golang-github-containernetworking-plugins/containernetworking-plugins_1.1.1+ds1-3build1_amd64.deb

sudo dpkg -i containernetworking-plugins_1.1.1+ds1-3build1_amd64.deb
More infomation about the background you can found in this blog post and in this bug report
Optional: Create Desktop Entry for Podman Desktop
To create a desktop entry for Podman Desktop, create a symbolic link to the application:
ln -s ~/.local/share/flatpak/exports/share/applications/io.podman_desktop.PodmanDesktop.desktop ~/.local/share/applications/
As you can see, Flatpak already offers a .desktop file; we just need to link it to the correct folder. This step creates a symbolic link to the Podman Desktop application in your local applications directory. This allows your desktop environment to recognize and display the Podman Desktop application in your application menu, making it easier to launch.
Edit the desktop entry to set the correct icon path:
vim ~/.local/share/applications/io.podman_desktop.PodmanDesktop.desktop
Change the Icon= line to:
Icon=<your_home_path>/.local/share/flatpak/exports/share/icons/hicolor/128x128/apps/io.podman_desktop.PodmanDesktop.png
Finally, restart your desktop environment to apply the changes. For X11, you can do this by pressing [ALT] + [F2], entering r, and pressing enter.
Further Resources
Ubuntu 22.04 LTS Filesystem Volume on Hyper-V
Ubuntu 22.04 LTS Filesystem Volume on Hyper-V
Expand the VHDX file via Hyper-V
To expand the VHDX file via Hyper-V, follow these steps:
1. Ensure there are no Checkpoints
Before proceeding, make sure your virtual machine has no checkpoints.
2. Navigate to Settings
Go to Virtual Machine > Settings... > SCSI Controller > Hard Drive.
3. Edit the Virtual Hard Disk
Press Edit under Media > Virtual hard disk.
4. Configure the New Size
In the pop-up dialog, configure the new size for your virtual hard disk.
Expand /dev/sda size
To expand the /dev/sda size, follow these steps:
1. Install Required Package
Install the cloud-guest-utils package.
sudo apt install cloud-guest-utils
2. Find the Virtual Disk Name
Use fdisk to find the name of the virtual disk.
sudo fdisk -l
In the output, you should find the device table:
Device      Start      End  Sectors  Size Type
/dev/sda1  227328 52428766 52201439 24,9G Linux filesystem
/dev/sda14   2048    10239     8192    4M BIOS boot
/dev/sda15  10240   227327   217088  106M EFI System
Here you can identify the device name. In this example, it is /dev/sda1.
3. Expand the Partition
Expand the partition into the free space.
sudo growpart /dev/sda 1
4. Resize the Filesystem
Resize the filesystem to use the new partition size.
sudo resize2fs /dev/sda1
5. Result
Check the new partition size with the df command.
df -h
Installing TPM TSS2 on Ubuntu
 # Installing TPM TSS2 on Ubuntu
This guide provides concise steps to check for TPM availability and install TPM TSS2 on an Ubuntu system (tested with Ubuntu 22.04 LTS).
1. Check for TPM Device
Ensure that a TPM device is available on your system:
ls /dev/tpm*
If /dev/tpm0 exists, a TPM device is present. If not, verify in your BIOS/UEFI settings that TPM is enabled.
2. Prepare the System
Update the system:
sudo apt update && sudo apt upgrade -y
3. Install TPM-TSS2 and TPM2 Tools
Install the TPM packages:
sudo apt install -y tpm2-tools
If you need the TPM resource manager daemon, install it with:
sudo apt install -y tpm2-abrmd
4. Enable the TPM Service
If you installed the TPM daemon, enable and start the service:
sudo systemctl enable tpm2-abrmd.service
sudo systemctl start tpm2-abrmd.service
5. Add user to tss group
Now you need to add your user to the tss group. This allows you to use the TPM daemon.
sudo usermod -aG tss $(whoami)
Afterwards refresh you environment.
newgrp tss
6. Verify the Installation
Test the installation by generating random data:
tpm2_getrandom --hex 8
If the output displays random hex values, TPM is functioning correctly.
With these steps, TPM TSS2 should be successfully installed and ready to use on your Ubuntu system.
Secure Memory in C/C++ with Libsodium

Memory security is crucial in C/C++ because these languages allow direct access to memory. Libsodium offers practical tools to address this, especially in its chapter on Secure Memory. It helps keep sensitive data like passwords and keys safe in RAM by providing protections such as locking and access control.
👉 Check out the documentation here: Libsodium Secure Memory
Creating Memory Dumps with gcore or gdb: A Practical Example

Introduction
Memory dumps are a crucial tool for analyzing the state of a program. With tools like gcore or gdb, developers can save the memory of a running process for debugging or to understand unexpected behavior. However, memory dumps can also expose sensitive information, such as passwords or cryptographic keys, if these are present in memory at the time of the dump. In this article, I’ll show you how to create memory dumps using gcore, analyze them, and highlight the importance of handling them securely.
What is gcore?
gcore is a simple command-line tool that is part of the GNU Debugger (gdb). It allows you to create core dumps, which are snapshots of a process’s memory, without terminating the process itself. These dumps contain:
- The state of the heap, stack, and other memory segments.
- Information about variables and data used by the program during runtime.
Example: Creating a Dump with gcore
Step 1: Create a Test Program
Let’s create a simple program that holds sensitive information, such as a password, in memory. The program will display its PID and remain active for a few minutes to allow analysis.
#include <iostream>
#include <string>
#include <thread>
#include <unistd.h>
#include <chrono>

int main() {
    std::string password = "SuperSecret123";
    std::cout << "Program is running... PID: " << getpid() << std::endl;

    // Keep the program running
    std::this_thread::sleep_for(std::chrono::minutes(5));

    return 0;
}
Compile the program:
g++ -o memory_test memory_test.cpp
Run it:
./memory_test
The program will display the PID and remain active for 5 minutes.
Step 2: Create a Dump with gcore
While the program is running, you can create a memory dump using gcore:
- Find the process ID (PID) if you don’t already have it from the program’s output:
ps aux | grep memory_test
- Create a dump with
gcore:
gcore -o dumpfile <PID>
This generates a file named dumpfile.
Step 3: Analyze the Dump
Use tools like strings to inspect the contents of the dump:
strings dumpfile.<PID> | grep "SuperSecret123"
If the password was not securely erased from memory, it will appear in the dump.
Alternatively: Creating the dump with GDB
Step 1: Attach to a Running Process
To analyze a specific process, you need to attach gdb to it using its process ID (PID). For example:
gdb -p <PID>
Replace
Step 2: Focus on Specific Memory Regions
Use the info proc mappings command to identify memory regions, such as the heap, stack, or code segments. For example:
(gdb) info proc mappings
This command displays memory regions with their start and end addresses, permissions, and associated paths. You can use this information to select the regions you want to analyze or dump.
Step 4: Combine Interactive Debugging with Memory Dumping
After inspecting the memory, you can dump specific memory regions to a file. For example, to dump the heap region:
(gdb) dump memory heap_dump.bin 0xheap_start 0xheap_end
Replace 0xheap_start and 0xheap_end with the actual addresses of the heap region obtained from info proc mappings
Why Does This Matter?
This example demonstrates how easily sensitive data like passwords or tokens can be extracted from memory if they are not securely cleared. In security-critical applications, developers should:
- Securely erase data immediately after use (see this article)
- Disable dumps when they’re not needed.
ulimit -c 0
Conclusion
gcore and gdb are powerful tools for analyzing the state of a program, but it also highlights potential security risks if sensitive data remains in memory. By securely clearing data and disabling unnecessary dumps, developers can better protect their applications from data leaks.
Further Resources
Securely Erasing Memory in C/C++: Why It’s Important and How to Do It Right
Introduction
In software development, it is often necessary to securely erase sensitive data from memory as soon as it is no longer needed. This is especially true for passwords, tokens, or other confidential information in security-critical applications. While the concept sounds straightforward, there are some important nuances to consider. In this article, I’ll explain why a simple memset is not sufficient to securely erase memory and provide an overview of alternatives.
The Problem: Why Erasing Isn’t Always Secure
A developer might assume that overwriting memory with a function like memset is enough to erase sensitive data.
A naive implementation might look like this:
void insecure_clean(void* ptr, size_t size) {
    memset(ptr, 0, size);
}
However, the issue lies in compiler optimizations. Modern compilers such as gcc or clang analyze code and may detect that the memory cleared by memset is no longer being used. Based on this analysis, the compiler could remove the memset operation entirely to optimize runtime performance.
Attack Vectors
Sensitive data that is not properly erased can be compromised in several ways:
- Memory Dumps: An attacker could create a core dump or analyze the memory using debugging tools like
gdb. - Unsafe Memory Deallocation: If memory is freed without being cleared, other programs or threads may access the leftover data.
For example, a password that remains in memory after authentication could be discovered and exploited by an attacker.
The Solution: How to Securely Erase Memory
There are various approaches to securely clear memory. These methods can be general-purpose, platform-specific, or depend on the compiler version. A comprehensive and robust solution is also offered by the external library Libsodium.
1. Using volatile
The volatile keyword prevents the compiler from optimizing out memory-clearing operations. By marking the memory pointer as volatile, the compiler is forced to perform each write operation, even if it considers them redundant. Here’s how it can be used:
void secure_clean(volatile void* ptr, size_t size) {
    volatile unsigned char* p = (volatile unsigned char*)ptr;
    while (size--) {
        *p++ = 0;
    }
}
2. Using Specialized Platform Functions
Many operating systems or standard libraries provide specialized functions for securely erasing memory. These functions use internal mechanisms to ensure that neither the compiler nor the hardware skips the clearing operation.
Unix
The explicit_bzero function securely erases memory and guarantees that the operation will not be removed by the compiler.
#include <string.h>

explicit_bzero(void *b, size_t len);
Windows
The SecureZeroMemory function ensures that memory is securely cleared.
#include <windows.h>

PVOID SecureZeroMemory(_In_ PVOID  ptr, _In_ SIZE_T cnt);
C23
The new memset_explicit function can also be used to securely overwrite memory.
#include <string.h>

memset_explicit( void *dest, int ch, size_t count );
3. Leveraging External Libraries
Libraries like Libsodium provide robust and platform-independent methods for secure memory erasure. These libraries are designed to securely remove sensitive data from memory while leveraging platform-specific optimizations.
#include <sodium.h>

sodium_memzero(void * const pnt, const size_t len);
4. Additional Security Measures
In addition to securely erasing memory, consider these practices to further protect sensitive data:
- Erase memory immediately: Clear data as soon as it’s no longer needed, rather than keeping it in memory longer than necessary.
- Avoid unnecessary copies: Minimize copies of sensitive data to reduce the number of locations that need to be cleared.
- Prevent memory dumps: Disable core dumps in security-critical applications. For example on Unix:
ulimit -c 0
Best Practices
- Prefer platform-specific or library-specific functions like
explicit_bzeroorsodium_memzero. - Use
volatileif no specialized function is available. - Erase sensitive data immediately once it’s no longer needed.
- Implement platform-specific mechanisms to protect memory from unauthorized access.
Conclusion
Securely erasing memory is an often-overlooked but critical aspect of software development. Attackers can exploit leftover data in memory if it is not properly erased. Fortunately, there are a variety of proven methods to address this issue. By combining secure memory-clearing functions with best practices, you can ensure that sensitive data is reliably removed from memory.